Essentials
£249/mo
or £199/mo billed annually
compliance, plus automation
Start free →What's new · Assets & network
An asset inventory tells you what you have. It doesn't tell you what talks to what, who has access to which system, or which single asset — if it went down or got compromised — would take the most of your business with it. That's a different kind of question, and it needs a different kind of view.
786 Cyber renders your entire estate as an interactive graph, four ways. Every view exports to PNG, so a graph that used to live only in your head now travels into a report or a board update.
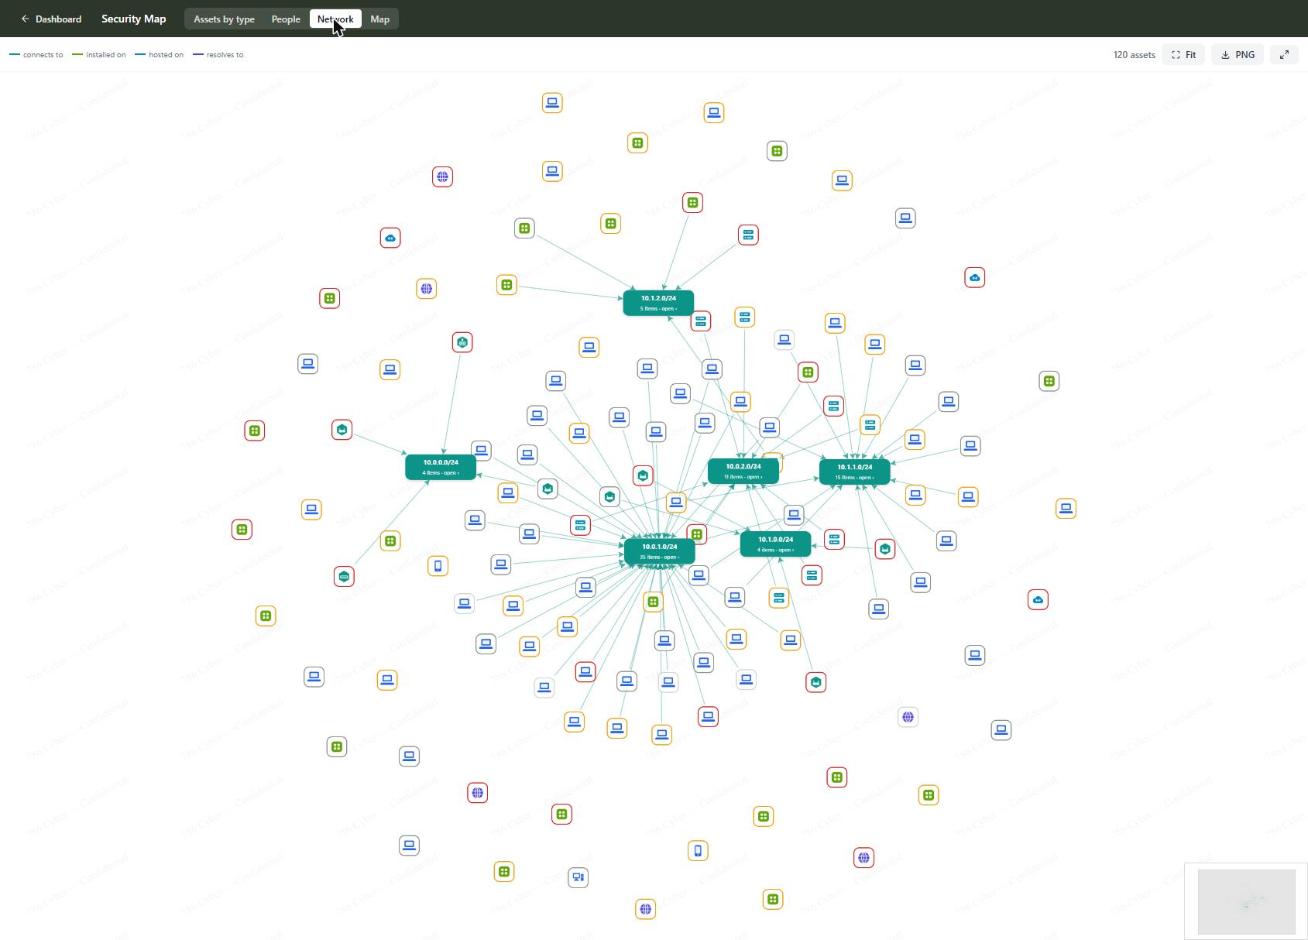
This is what's sometimes called a relationship graph — nodes are assets or people, edges are labelled relationships, and the layout is force-directed, meaning structurally important nodes (the ones with the most connections, or the highest criticality) surface visually instead of requiring you to spot them in a spreadsheet.
The Network view could already show you which assets were linked. The enhancement adds two things that turn "linked" into "how, and how much does it matter." Typed connection links now label the relationship itself — "connects to", not just a line between two dots — so the graph reads like a real network diagram instead of an abstract web. Criticality-weighted risk rings make an asset's importance visually obvious: a critical asset with several connections doesn't just get a red label, it gets a visible ring that scales with how much risk sits at that node.
Together, these mean a five-second glance at the Network view now answers a question that used to take a spreadsheet and a coffee: which asset, if it went down, would take the most business-critical infrastructure with it?
Understanding blast radius before an incident, not while you're in the middle of one.
Start a 14-day free trial — no card required.
£249/mo
or £199/mo billed annually
compliance, plus automation
Start free →£549/mo
or £439/mo billed annually
for a scaling security function
Start free →£1,199/mo
or £959/mo billed annually
for an established programme
Start free →Just need to get compliant? Comply from £149/mo. Larger or regulated? Enterprise from £2,500/mo — talk to us →. All prices ex-VAT.